The Foundation for the Study of Cycles is a registered 501(c)(3) non-profit educational institution. Your contribution is tax-deductible to the extent permitted.
Donate by Mail
Foundation for the Study of Cycles, PO Box 177, Floyd, VA 24091
Tax information
Foundation for the Study of Cycles is registered as a 501(c)(3) non-profit organization. Contributions to the FSC are tax-deductible to the extent permitted by law. The Foundation’s tax identification number is 83-2540831.
The Foundation for the Study of Cycles is a nonprofit research and educational institution dedicated to the interdisciplinary study of recurring patterns in all areas of research. Your generous donation supports continued research for the betterment of our world.
Foundation for the Study of Cycles, PO Box 177, Floyd, VA 24091
Tax information
Foundation for the Study of Cycles is registered as a 501(c)(3) non-profit organization. Contributions to the FSC are tax-deductible to the extent permitted by law. The Foundation’s tax identification number is 83-2540831.
Reset Password
???
Thank you for the registration and welcome the FSC!
The Foundation for the Study of Cycles is a registered 501(c)(3) non-profit educational institution. Your contribution is tax-deductible to the extent permitted.
Donate by Mail
Foundation for the Study of Cycles, PO Box 177, Floyd, VA 24091
Tax information
Foundation for the Study of Cycles is registered as a 501(c)(3) non-profit organization. Contributions to the FSC are tax-deductible to the extent permitted by law. The Foundation’s tax identification number is 83-2540831.
Blog
August 2, 2022News
3.029- and 3.606-Minute Cycles in Solar Wind Speed
Originally posted on Cycles Research Institute’s blog on 8/10/2015 by Ray Tomes
Author's update: 9/02/2022
The cycles found in solar wind speed had a bunch of periods around 3.0291 and 3.6065 minutes, which were found to be very stable cycles periods from one day to the next, but the amplitudes got stronger and weaker over a few days.
When the analysis was repeated after some years, quite different periods were found, but again stable over a few days. Clearly the periods must depend on some physical aspects of the sun and perhaps the solar system that change gradually but are very stable for days at a time. The cause is not at all obvious.
The pattern in the spectrum found is rather similar to the spectra of chemical elements except that the atomic frequencies are some 15 orders of magnitude faster. In each case there are some dominant frequencies, with many other lesser frequencies nearby. In atomic frequencies this is called fine structure and there is also hyperfine structure around these fine-structure frequencies, and which is observable with increased magnification of the spectrum.
Such behavior can perhaps be understood because of the similarity between nucleus, electrons, and atom to sun, planets, and solar system.
Original: 8/10/2015
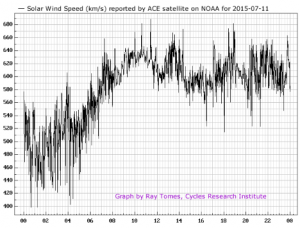
The ACE satellite measures the solar wind speed (among other things) of particles traveling from the sun towards the earth. Located at the L1 libration point it is always around 1.5 million km in the direction of the sun and so can give about an hour warning of space weather changes. The solar wind speed is typically in the range of 300 to 700 km/s.
This 1-minute interval real time data remains available for only a short period of time. The present analysis was done on data recorded on 11th July 2015 and there are 1440 (less about 20 or so missing) measurements at 1-minute intervals. The analysis was done using our free CATS software.
Firstly, the rapidly fluctuating solar wind speed is shown.
It can be seen that minute by minute there are substantial changes in solar wind speed. A spectral analysis of the solar wind speed shows a number of cycles significant at p=0.05 level as listed in this table:
No. Of Cycles
Cycle Period Minutes
Date of Peak
Cycle Strength
Bartell’s Test (p=)
399.28
3.60649
2015.5252621
0.098406
0.00000000
475.39
3.02909
2015.5252634
0.076864
0.00000000
398
3.61809
2015.5252620
0.054579
0.00001875
400.83
3.59255
2015.5252648
0.050971
0.00014225
402.19
3.58040
2015.5252665
0.045818
0.00079066
49.32
29.19708
2015.5253121
0.070705
0.00204380
395.79
3.63829
2015.5252675
0.039579
0.00348685
217.41
6.62343
2015.5252699
0.042097
0.00369764
476.69
3.02083
2015.5252647
0.036243
0.00429099
50.53
28.49792
2015.5252634
0.060138
0.00621892
215.95
6.66821
2015.5252676
0.038759
0.00634786
474.01
3.03791
2015.5252625
0.032432
0.00820103
403.29
3.57063
2015.5252618
0.034605
0.00867797
74.88
19.23077
2015.5252801
0.046984
0.01230259
194.41
7.40703
2015.5252621
0.038716
0.01238090
32.64
44.11765
2015.5252903
0.042015
0.01393355
48.11
29.93141
2015.5253090
0.055255
0.01451557
161.24
8.93079
2015.5252751
0.043495
0.01474822
324.51
4.43746
2015.5252652
0.036788
0.01493206
482.48
2.98458
2015.5252647
0.020699
0.01656507
172.13
8.36577
2015.5252655
0.038061
0.01716400
76.21
18.89516
2015.5252839
0.050419
0.01754671
39.99
36.009
2015.5253088
0.057387
0.01863100
565.36
2.54705
2015.5252626
0.032063
0.02572346
160.07
8.99606
2015.5252717
0.03406
0.02682052
25.42
56.64831
2015.5252675
0.043156
0.02765430
120.2
11.98003
2015.5252833
0.036602
0.02871458
14.77
97.49493
2015.5253709
0.071089
0.03136794
222.09
6.48386
2015.5252709
0.035618
0.03216350
394.53
3.64991
2015.5252657
0.030707
0.03295080
230.47
6.2481
2015.5252618
0.031044
0.03326301
211.72
6.80144
2015.5252714
0.034033
0.03358752
210.13
6.8529
2015.5252671
0.031237
0.03360750
477.93
3.01299
2015.5252662
0.028155
0.03678022
274.73
5.24151
2015.5252660
0.031051
0.03685700
83.61
17.22282
2015.5252927
0.047398
0.03700348
47.23
30.4891
2015.5253041
0.057521
0.03791188
78.49
18.34629
2015.5252890
0.048698
0.03937316
23.15
62.20302
2015.5253658
0.065049
0.04028760
554.02
2.59918
2015.5252628
0.026363
0.04334227
247.27
5.82359
2015.5252616
0.029738
0.04570371
173.65
8.29254
2015.5252681
0.033344
0.04915963
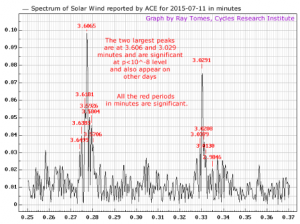
The first two listed cycles in particular are extremely significant and would not occur even one time in a hundred million by chance alone. The Bartell’s test shows the significance of cycles as a probability. They did occur in two different days that I analyzed, with extremely similar periods.
The part of the spectrum near to these two cycles is shown because there are other significant cycles nearby:
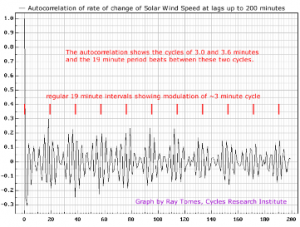
A graph of the autocorrelation of the minute-by-minute changes of the solar wind speed up to 200 minutes lag is shown:
This shows how the change in solar wind speed compares to the corresponding change at lags of up to 200 minutes and it can be clearly seen that there is a cycle of 3 minutes or so, and also that there is a modulation of 19 minutes in the autocorrelation. The two dominant cycles periods will produce beats of 18.92 minutes just as we observe. Note that there are two actual cycles near to 19 minutes also.
The author has often found cycles of near 3 and 6 minutes in the solar system previously. Along with 80 and 160 minutes these periods are rather common. We may note that the inner planets are roughly spaced at 3 light minutes apart in distance from the Sun, and the outer planets at 80 light minutes apart.
In my previous post to CRI Blog, I reported on Kotovs method of analyzing planetary distances from the Sun gives spacings which are multiples or fractions of 0.376, 0.734, 5.01 and 10.06 AU. Light travels 1 AU in 8.317 minutes, so these distances can be converted to periods of an electromagnetic (or gravitational) standing wave of 3.13, 6.10, 41.7, and 83.7 minutes. In the solar wind speed as well as many cycles around 3 minutes or so there are a number at a little over 6 minutes.
Two periods of 3.17 and 6.34 minutes have also been found by the author in fluctuations in the rate of radioactive decay of Plutonium as measured by Biophysics laboratory at Russian Academy of Sciences in Pushchino. These periods are not perfectly steady but wander about by around 5%.