By Ron William, CFTe, MSTA

Seasonality Patterns Realign


Global markets clearly decided to sell in May (SIM) this year, but rather than go away, opportunistic speculators returned straight away, with S&P500 bouncing twice by almost 10% from oversold extremes during late May and mid-June. Market professionals are now debating if they should buy the dip, or sell the rally.

The latest market insights are featured in this interview, which also reviews the change in market regime and implications for a reassessment of market & mind strategies. Moreover, it helps to answer the question, “How low can it go?” by overlaying tactical structural levels based on Dow theory and Fibonacci ratios (Figure 1).

Most important is the make-or-break level at 3520, a 50% retracement of the 2020 uptrend. Breaking under here extends downside scope into pre-pandemic peak-gap between 3370 and 3260, near 3220, a golden ratio of 61.8%. The grand finale structural level is at 3100, representing a two-third retracement and potential technical reversal of the bull run from 2020. This would also reinforce the Minsky Crash Pattern published in our last FSC blog and previous interviews.

How Low Can the S&P Go?

Returning to the original theme of seasonality, further useful analysis can be found in these annual cycles which can bring a marked change not only to the weather, but also the surrounding investment landscape. The SIM phrase began in England and was originally dubbed sell in May and go away until St. Leger's Day, named for a popular horse race (St. Leger Stakes) in September, which marked the end of summer and a return of stock market traders, fueled by big trading volume.

Since 1950, the May through October period has generated the lowest six-month period of returns for the S&P 500, with an average return of 1.8% and a win ratio of 65%. That compares to the period of November through April, when the S&P 500 has generated an average return of 7.1% with a win ratio of 78%.

However, while historically May through October has been a weak stretch for stocks, that hasn't been the case over the past decade. The S&P 500 was up 9 out of the last 10 years from May through October, delivering an average return of 5.7%. Nevertheless, our seasonality analysis predicts a return to the traditional pattern, with the risk of a worst performing month in June and September (Figure 2). This is further weighed by negative returns exhibited in a presidential midterm election year.

SIM Pattern Weakest June & Sept.

Since the time of this writing, the SIM pattern triggered one of the weakest June 2022 returns in history (Figure 3). It broke the record of both the global financial crisis of 2008 and the Kennedy-slide Cuban Missile Crisis of 1962, thereby setting a new outlier variation of this historical rhyme. This also implies the growing probability of a sharp upside mean-reversion from oversold extremes into this new month of July, which fits with the typical mid-summer rally pattern until August.

June 22 Lowest in History

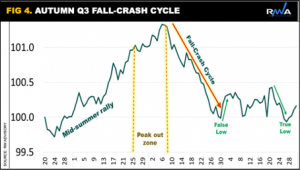
The strongest probabilities favor a market peak/drawdown process in the month of August. Mr. Market should lead us into the well-known autumn (Q3) fall crash cycle that traditionally unfolds between September and October. Figure 4 illustrates the shape of this negative seasonal pattern, which is based on the average performance of over 100 years of back-tested price data on the DJIA.

Q3 Fall Crash Cycles


These results tell us the largest price fall can be expected in late September, followed by a volatile rise/whipsaw, then another fall in October, which traditionally marks the final capitulation true low in the market. Recall the Minsky Crash Pattern that should now reactivate below the June low of 3640, with a risk of further downside into the pre-pandemic zone between 3400-3260. Our Roadmap cycle model also remains negative for H2 2022 into 2023. Stay alert!

Thank you to all FSC members for all your kind feedback and insightful questions on our new FSC Blog market series! I welcome more interaction: ron.william@cycles.org

Read Ron William's full bio here (bottom of the page).


SHARE THIS POST